Sun Map vs Shade Map Infographic


Sun Map highlights areas with direct sunlight exposure throughout the day, essential for optimizing solar panel placement and gardening. Shade Map identifies regions shaded by trees, buildings, or other obstacles, helping to avoid areas with limited sunlight. Comparing Sun Map vs Shade Map allows precise planning for energy efficiency and plant growth by balancing sunlit and shaded zones.
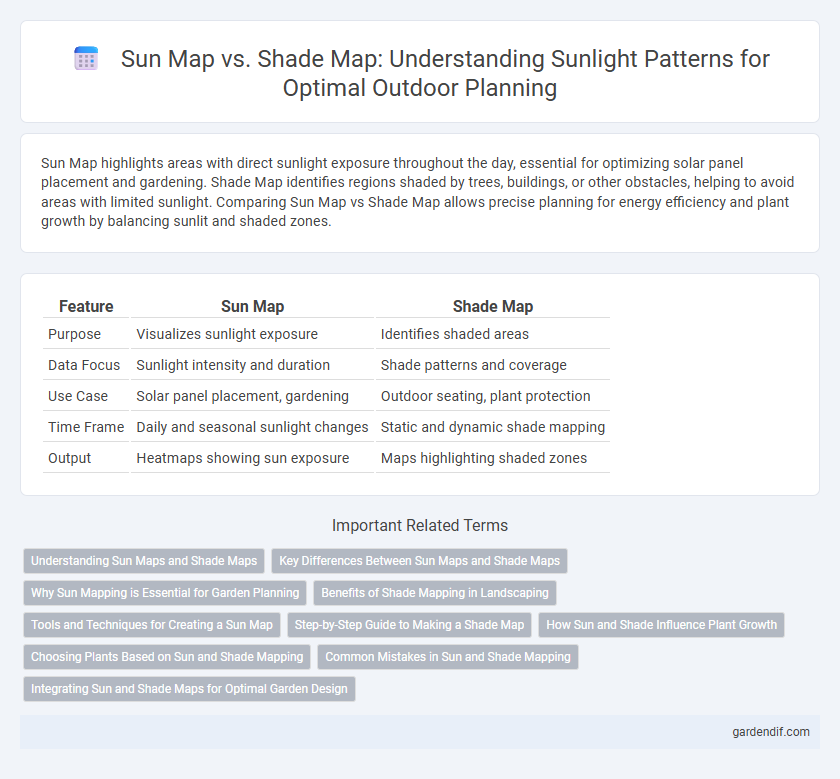
Table of Comparison
| Feature | Sun Map | Shade Map |
|---|---|---|
| Purpose | Visualizes sunlight exposure | Identifies shaded areas |
| Data Focus | Sunlight intensity and duration | Shade patterns and coverage |
| Use Case | Solar panel placement, gardening | Outdoor seating, plant protection |
| Time Frame | Daily and seasonal sunlight changes | Static and dynamic shade mapping |
| Output | Heatmaps showing sun exposure | Maps highlighting shaded zones |
Understanding Sun Maps and Shade Maps
Sun Maps illustrate the distribution and intensity of sunlight across a specific area, helping to identify zones with maximum sun exposure for optimal solar panel placement or gardening. Shade Maps detail the shadows cast by buildings, trees, or other obstructions, crucial for evaluating potential areas with reduced sunlight throughout the day. Understanding the differences between Sun Maps and Shade Maps enables more effective planning in urban design, agriculture, and renewable energy projects by maximizing sun exposure and minimizing shading effects.
Key Differences Between Sun Maps and Shade Maps
Sun maps visualize the distribution and intensity of sunlight on surfaces throughout the day, highlighting areas of direct solar exposure. Shade maps identify regions obscured from sunlight due to obstructions like buildings, trees, or terrain, emphasizing shadow patterns. The key difference lies in sun maps emphasizing solar irradiance for energy or agricultural planning, while shade maps aid in understanding shadow impact for comfort, design, and temperature regulation.
Why Sun Mapping is Essential for Garden Planning
Sun mapping identifies precise sunlight exposure patterns throughout the day, enabling gardeners to select plants best suited for specific light conditions. Shade mapping, while useful for understanding shaded areas, lacks the detail required to optimize plant placement for growth and flowering. Accurate sun mapping enhances garden productivity, ensures plant health, and maximizes aesthetic appeal by aligning plant needs with actual sunlight availability.
Benefits of Shade Mapping in Landscaping
Shade mapping in landscaping provides precise analysis of sunlight patterns and shadow projections, enabling optimal plant placement for health and growth. It helps in designing outdoor spaces that enhance comfort and energy efficiency by identifying cool, shaded zones. This approach supports sustainable landscaping by reducing water usage and protecting sensitive vegetation from excessive sun exposure.
Tools and Techniques for Creating a Sun Map
Sun maps are generated using solar path algorithms and geographic information systems (GIS) to illustrate sunlight exposure throughout the day, providing precise data on sun angles and intensity. Shade maps rely on 3D modeling and digital terrain analysis to identify shadow patterns cast by buildings, trees, and other obstacles, essential for understanding shading effects in urban planning. Advanced tools such as LiDAR scanning, satellite imagery, and software like HelioScope or SketchUp enhance accuracy in creating sun and shade maps for solar energy optimization and architectural design.
Step-by-Step Guide to Making a Shade Map
A shade map illustrates areas of shadow caused by obstacles like buildings or trees throughout the day, unlike a sun map which highlights sun exposure by tracking direct sunlight. To create an accurate shade map, begin by selecting a specific location and date, then observe and record shaded areas hourly from sunrise to sunset. Use this collected data to draft a visual representation indicating shade patterns, which aids in optimizing outdoor planning or garden design based on shadows cast at various times.
How Sun and Shade Influence Plant Growth
Sun maps illustrate the intensity and duration of sunlight exposure crucial for photosynthesis and plant development, highlighting areas with optimal light for growth. Shade maps identify zones with reduced sunlight, which affect temperature, moisture retention, and can limit photosynthetic efficiency in shade-tolerant or shade-sensitive species. Understanding the interplay between sun and shade enables precise planning for planting locations, ensuring plants receive appropriate light conditions to maximize health and yield.
Choosing Plants Based on Sun and Shade Mapping
Sun map and shade map are essential tools for understanding sunlight patterns, guiding the selection of plants suited to specific garden zones. Sun maps highlight areas with maximum direct sunlight, ideal for sun-loving species like lavender and tomatoes, while shade maps reveal cooler, low-light spots perfect for shade-tolerant plants such as ferns and hostas. Utilizing both maps ensures optimal plant growth by matching species to their preferred light conditions, enhancing garden health and productivity.
Common Mistakes in Sun and Shade Mapping
Common mistakes in sun and shade mapping often include confusing the sun map, which highlights areas receiving direct sunlight throughout the day, with the shade map, which identifies zones consistently shielded from the sun. Another frequent error is neglecting seasonal changes in solar angles that affect shadow lengths and sun exposure patterns. These inaccuracies lead to poor landscape planning, reducing plant health and energy efficiency in architectural design.
Integrating Sun and Shade Maps for Optimal Garden Design
Integrating sun maps and shade maps enables precise identification of sunlight patterns and shaded areas throughout the day, optimizing plant placement for health and growth. Combining these datasets supports strategic garden design by matching plant species' light requirements with actual site conditions, maximizing photosynthesis and reducing water stress. Using GIS tools to overlay sun and shade maps ensures informed decisions for efficient irrigation planning and sustainable landscaping.
Sun Map vs Shade Map Infographic